
I know it’s not the season for Eurovision. It has been 6 months since Eurovision 2019 and next 6 months for Eurovision 2020. So,while waiting for another 6 months, we can perhaps talk about it at least, can’t we?
A tiny bit of history of Eurovision
According to wikipedia, the first Eurovision contest was held in Lugano, Switzerland on May 24th, 1956. Only seven countries participated and Switzerland, the host nation, won the contest. However, except for the winning song, the results have never been published. So, for 1956, there is no point of getting result for 1956 as long as you are curious about ranking.
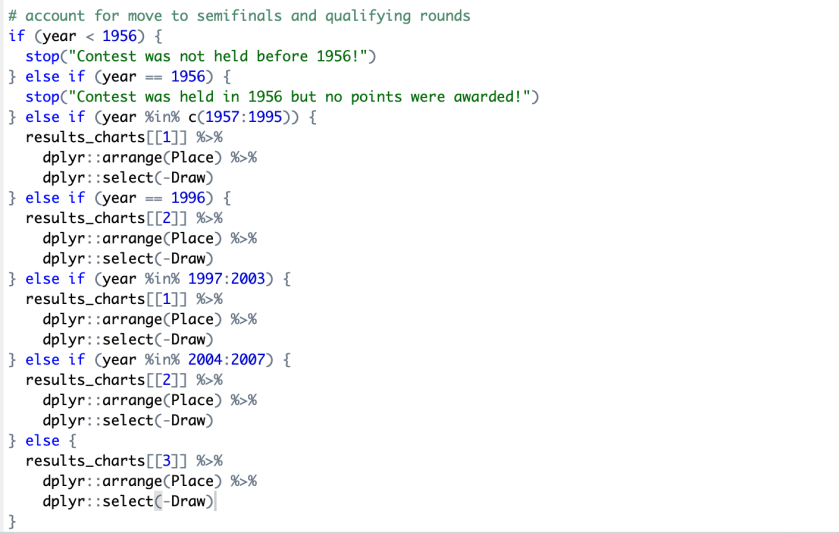
Using this information and the format of the wikipedia website(from 2004, it started to include semi-final result), here is a part of the automated function. In dplyr library, arrange function enables to arrange the data set by the variable. In this code, the arrange function will sort the variable by place.
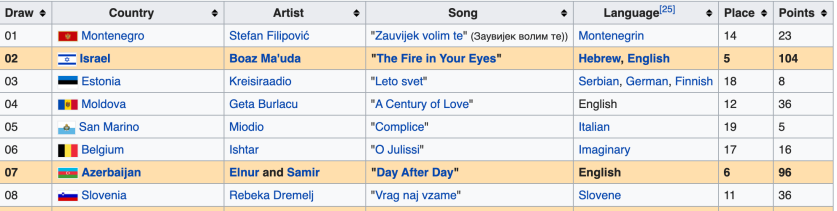
In other words, the automated function that I will show later will print out the result by place instead of draw like the one in the picture. When you use ‘-‘ in select function, it means it drops the variable. Therefore, in the result from the function, it will drop the draw column.
Basic of web-scraping
You want to do web-scraping and extract the information that you are looking for. The very first question would be what website I will extract information that I need.
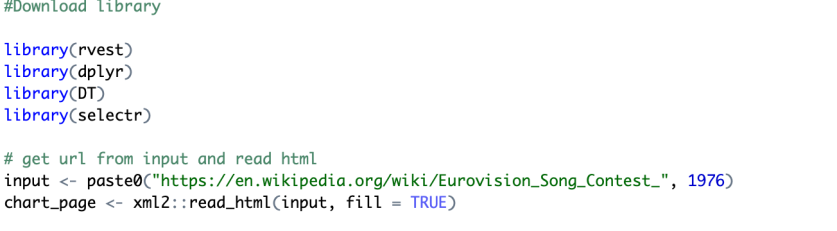
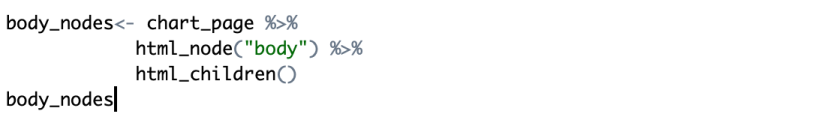
I found out that you can find information about Eurovision result for each year by adding “_year” after the eurovision song contest wikipedia page and it makes my life quite easier. In this step, it enables to read the html.
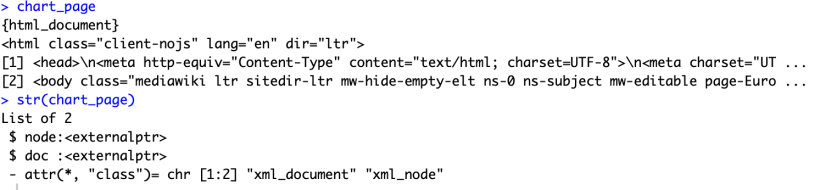
This is the output and the function has captured the entire content of the page in the form of a special list-type document with two nodes <head> and <body>. Almost always we are interested in the body of a web page. You can select a node using html_node() and then see its child nodes using html_children().
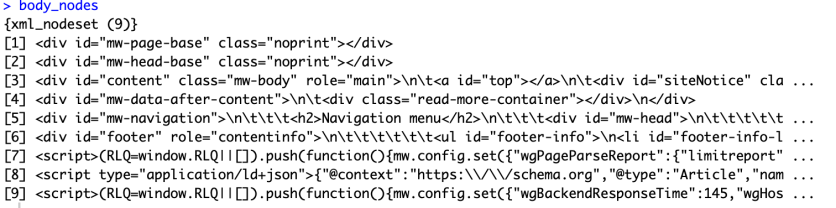
This should give you a list of nodes inside the body of the page.

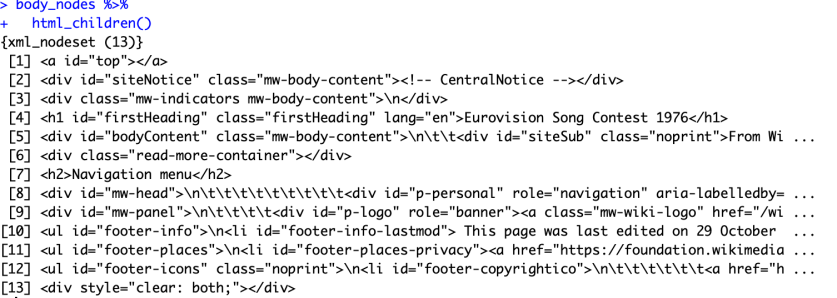
If we want, we can go one level deeper, to see the nodes inside the nodes. In this way, we can just continue to pipe deeper into the code.
At least, we know that we want something from “content”, but it’s not interpretable enough. What we need at this moment is Chrome Developer tool.
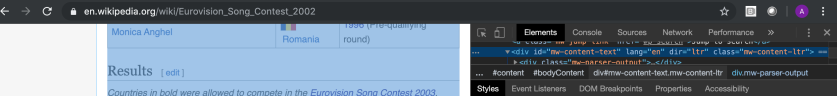
As scrolled down to the result section using this tool, it shows “div_id = “mw-content-text” and that’s what we exactly need for html_node. Also, we want something that is ‘sortable’. As we saw earlier, “place” column was obviously sortable.
Automated function
But very likely, you want to know at least several years of Eurovision result, not just one year. Hence, I created automated function that generate the result of the year that you selected and named it “get_eurovision“.
#Eurovision——-automated function
get_eurovision <- function(year) {
# get url from input and read html
input <- paste0(“https://en.wikipedia.org/wiki/Eurovision_Song_Contest_”, year)
chart_page <- xml2::read_html(input, fill = TRUE)
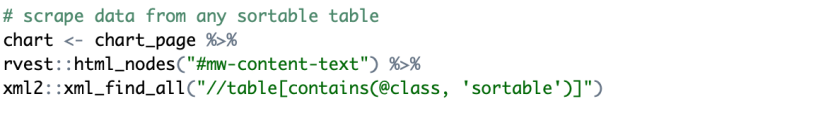
# scrape data from any sortable table
chart <- chart_page %>%
rvest::html_nodes(“#mw-content-text”) %>%
xml2::xml_find_all(“//table[contains(@class, ‘sortable’)]”)charts <- list()
chartvec <- vector()for (i in 1:length(chart)) {
assign(paste0(“chart”, i),
# allow for unexpected errors but warn user
tryCatch({rvest::html_table(chart[[i]], fill = TRUE)}, error = function (e) {print(“Potential issue discovered in this year!”)})
)charts[[i]] <- get(paste0(“chart”, i))
# only include tables that have Points
chartvec[i] <- sum(grepl(“Points”, colnames(get(paste0(“chart”, i))))) == 1 & sum(grepl(“Category|Venue|Broadcaster”, colnames(get(paste0(“chart”, i))))) == 0
}results_charts <- charts[chartvec]
# account for move to semifinals and qualifying rounds
if (year < 1956) {
stop(“Contest was not held before 1956!”)
} else if (year == 1956) {
stop(“Contest was held in 1956 but no points were awarded!”)
} else if (year %in% c(1957:1995)) {
results_charts[[1]] %>%
dplyr::arrange(Place) %>%
dplyr::select(-Draw)
} else if (year == 1996) {
results_charts[[2]] %>%
dplyr::arrange(Place) %>%
dplyr::select(-Draw)
} else if (year %in% 1997:2003) {
results_charts[[1]] %>%
dplyr::arrange(Place) %>%
dplyr::select(-Draw)
} else if (year %in% 2004:2007) {
results_charts[[2]] %>%
dplyr::arrange(Place) %>%
dplyr::select(-Draw)
} else {
results_charts[[3]] %>%
dplyr::arrange(Place) %>%
dplyr::select(-Draw)
}}
Now let’s try out the function. For example, I want to know the result in 1974.
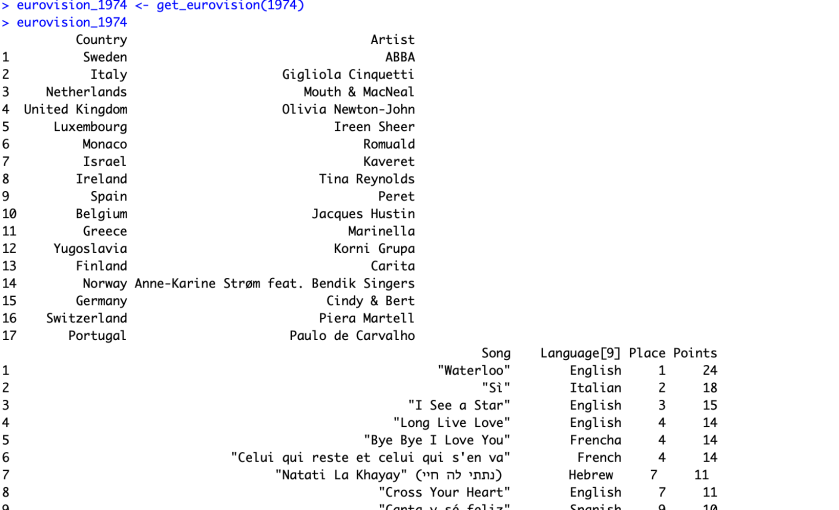
As you can see, ABBA won Eurovision in the first place with “Waterloo”.:)